Service pages and charts
Who can do this: viewers, operators and organization administrators can open any service page in their organizations. Acknowledge, mute and downtime controls appear only for operators and organization administrators. The Edit service name and alarm thresholds / delays panel appears only for organization administrators.
Open a service page by clicking a card in Your Services, a row in Active Alarms or a row in Current Downtimes on the dashboard. The address is /services/<id>. If the service does not exist, belongs to an organization you have no role in, or has been archived, Pulse returns a "not found" response instead of the page.
Unless stated otherwise, every time on this page is shown in the timezone set on your profile (see Your profile and notification settings), in the format Mon DD, YYYY HH:MM:SS. The page repeats this at the bottom: "Times on the chart and most displays (alarms, downtimes, events, last telemetry, etc.) are shown in your local timezone (…)".

The service page header: status pill, current value, last telemetry time, location and the Acknowledge button.
Header and status
| Element | Meaning |
|---|---|
| Service name | Page title. |
| Single channel / Multi (N channels) | How many channels are mapped to the service, not counting battery channels. A service with no channel mapped yet also reads Single channel. |
| Status pill | OK, WARNING or CRITICAL — the worst state across the service's channels. The pill never reads STALE; staleness is shown by the banner below. |
| Current value and unit | The latest reading of the service's primary channel, in large type. |
| Last telemetry: | Time of the most recent reading, or "—" if none. |
| 📍 Location and 👥 Groups | The asset's location and groups, when set. |
| 🔔 Notifies group: X | The notification group for the service. Organization administrators only. |
Stale banner
When no reading has arrived within the service's stale threshold, a grey banner appears under the last-telemetry line:
⚠ STALE — no data since Sep 07, 2026 14:05:32 (— min ago)
The time is when Pulse marked the service stale (the stale threshold after the last reading), in your timezone. The "min ago" figure reads "—". What stale means, and how the threshold is chosen, is covered in How alarms work.
Acknowledge control
The acknowledge area sits at the right of the header. It appears only while the status is WARNING or CRITICAL, or while an acknowledgement is in place:
- Operators and organization administrators see Acknowledge (recorded with the comment "Acknowledged via service detail"), or, once acknowledged, "Acknowledged by X" with Remove acknowledgement.
- Viewers see "Acknowledged by X" or the text "Active alarm — acknowledge requires operator access".
There is no confirmation step. What acknowledging does is explained in Acknowledging alarms.
Trends
The Trends panel shows one line chart per channel. Battery channels and the internal setpoint and state channels used for percentage-based limits are not charted. If no channel is mapped, the panel reads "No metrics configured for this service."
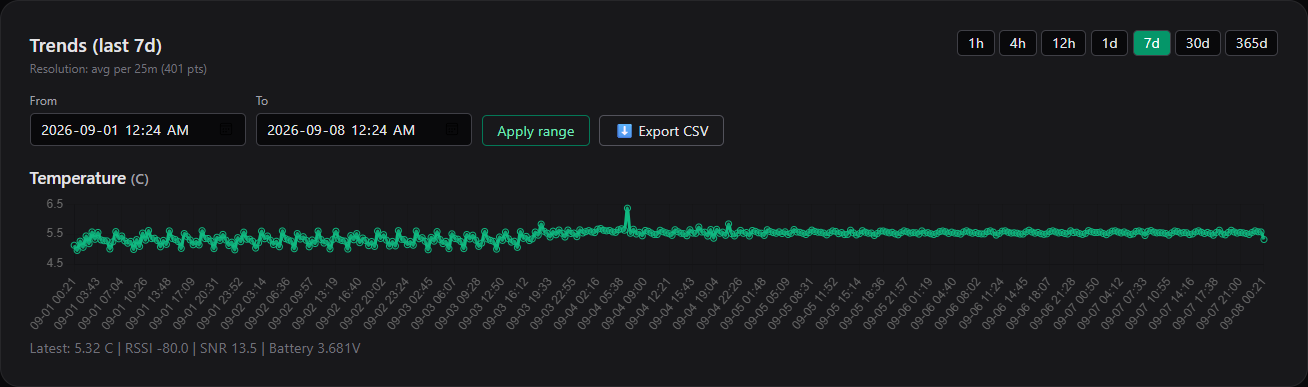
Trends with the 7d range selected: the Resolution line, the chart and the Latest line.
Choosing a window
| Control | Behaviour |
|---|---|
| Range buttons 1h, 4h, 12h, 1d, 7d, 30d, 365d | Show the window ending now. The default is 12h; the heading reads Trends (last 12h). The selected button is highlighted. |
| From / To and Apply range | Show any window, including one entirely in the past. Enter the times in your profile timezone. A To time in the future is clamped to now. If From is not earlier than To, the page falls back to the selected range button. The heading reads Trends (custom range). |
| ⬇ Export CSV | Downloads the readings for the window currently shown. See Exporting data. |
Changing the window only reloads the Trends panel; the rest of the page is unchanged.
Resolution
The Resolution: line under the heading tells you how the chart was drawn:
| Text | Meaning |
|---|---|
N raw points |
The window contains 800 readings or fewer, so every reading is plotted as recorded. Spikes are preserved. |
avg per 5m (400 pts) |
The window contains more than 800 readings, so it is divided into about 400 equal time buckets and the average of each bucket is plotted. Short spikes are smoothed by the averaging; use a shorter window or export the CSV to see individual readings. |
no data in range |
There are no readings in the window. The chart then shows a placeholder line drawn around the current value rather than real readings. |
The resolution shown is that of the first chart; each chart is downsampled independently.
Chart labels along the time axis are HH:MM for windows up to 36 hours, MM-DD HH:MM for windows up to 14 days and YYYY-MM-DD for longer windows, all in your timezone. Hover a point to read its value, rounded to two decimals, with the unit.
Latest reading line
Under each chart a Latest: line shows the most recent reading for that channel, followed by any of:
| Item | Meaning |
|---|---|
(raw 22.87 · cal ×1 +0.5) |
A calibration is applied to this channel. The first number is the reading as the sensor sent it; the reading shown everywhere else is raw × scale + offset. Hover the text for the tooltip "A per-channel calibration is applied to this reading (set on the device's page)." See Calibration. |
RSSI -87 |
Radio signal strength of the last packet, in dBm. |
SNR 9.5 |
Signal-to-noise ratio of the last packet, in dB. |
Battery 3.01V |
Battery voltage reported by the device. |
An item is omitted when the device did not report it. Readings recorded before a calibration was set are never recalculated, so older points on the chart keep the values they had when they arrived.
Currently in downtime
While a downtime window is active for the service, an amber panel titled Currently in downtime appears under Trends, showing the reason, the window (start → end, in your timezone) and Scheduled by. During the window the service's alarms are not listed on the dashboard and no notifications are sent, but the status pill and the charts continue to show real conditions.
Alarm Limits & Delays
This panel appears only when limits have been configured for the service. For a multi-channel service it shows one section per channel, each headed with the channel label (or "service-wide" for limits that apply to the whole service).

Alarm Limits & Delays: the gradient bar with four markers and the Low/High legend.
- Gradient bar — the configured limits placed on a scale from the lowest limit (left) to the highest (right). Each limit is a white tick with its value in a pill: red pills are CRITICAL limits, amber pills are WARNING limits. The end labels read LOW / COLD and HIGH / HOT when both low and high limits exist; when only high limits exist they read Warning High and Critical High, and when only low limits exist Critical Low and Warning Low.
- Legend — under the bar, low limits on the left (CRITICAL above WARNING) and high limits on the right (WARNING above CRITICAL). Each line shows the severity, the limit name (for example
CRITICAL_HIGH) anddelay Nm / sustained Nm.
What delay and sustained mean is explained in How alarms work. Limits are set by organization administrators; see Alarm limits and policies.
Mute control
A small panel under the limits shows the mute state of the service:
| You see | Meaning |
|---|---|
| Mute notifications for this service | Notifications are not muted. Operators and organization administrators can click to mute; the mute is recorded with the reason "Muted from service page". No confirmation step. Under the button: "Sticky mute for future alarms. Alarm state remains visible. Separate from acknowledging a current alarm." |
| Notifications muted by X since T — reason with Unmute | Notifications are muted. Operators and organization administrators can click Unmute. |
| "Notifications active — muting requires operator access" | Notifications are not muted, and you are a viewer. |
What muting suppresses, and how it differs from acknowledging and downtime, is in Muting and downtimes.
Edit service name and alarm thresholds / delays
Organization administrators see a collapsible panel with this title. It contains the service's name, notification settings, Stale after threshold and the four limit editors, plus the AI recommendation area (Recommend button and status). Operators and viewers do not see this panel. It is documented in Services and channel mapping and Alarm limits and policies.
If the panel shows the amber note "AI recommendations disabled for this service: …", recommendations are not available for that service; the note gives the reason. Recommendations are produced by Lab Monitors infrastructure — if a request stays in progress indefinitely, contact Lab Monitors support to check the recommendation service.
Recent Events
Recent Events lists the eight most recent alarm events for the service, newest first, or "No recent events." Each entry shows the event type, the severity change in brackets, the value at the time (when there is one), the time in your timezone and by whoever recorded it — your colleague's name for acknowledgements made in Pulse, or a Pulse component name for automatic events. Entries with no recorded actor read "by system".
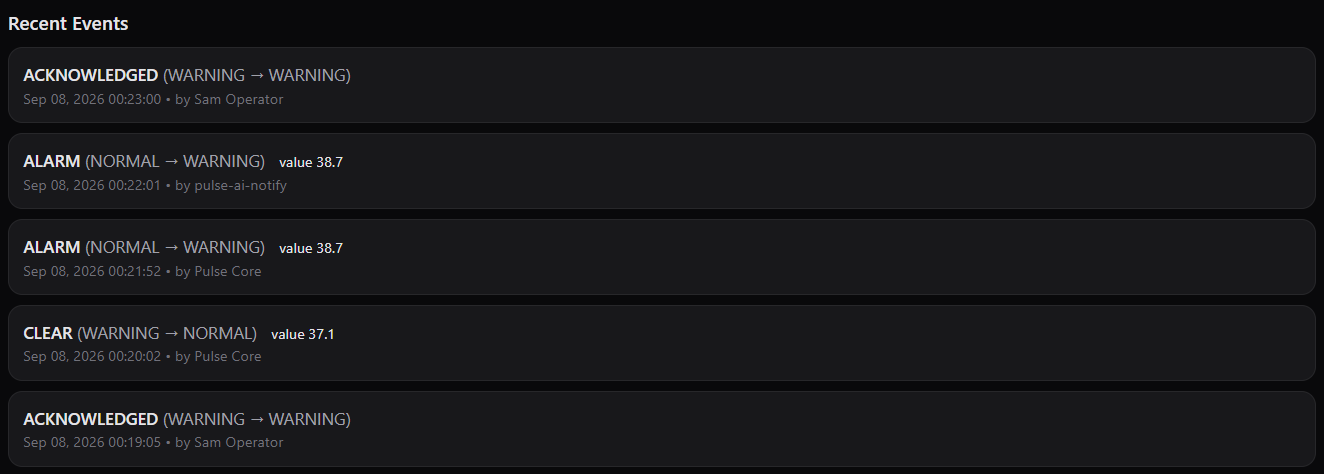
Recent Events: ALARM, ACKNOWLEDGED and CLEAR rows.
| Event type | Meaning |
|---|---|
| ALARM | The service entered WARNING or CRITICAL, or moved between them. The bracket shows the change, for example (NORMAL → CRITICAL) or (WARNING → CRITICAL). A second ALARM entry with the same change and NORMAL → records that the alarm notification was sent. |
| CLEAR | A reading came back within limits; the bracket ends in → NORMAL. |
| STALE | Readings stopped arriving within the Stale after threshold. The bracket repeats the last known severity, for example (NORMAL → NORMAL). |
| RECOVERED | Readings resumed after a stale period. The bracket again repeats the severity. |
| ACKNOWLEDGED | Someone acknowledged the alarm; the bracket repeats the acknowledged severity. |
| UNACKNOWLEDGED | Someone removed the acknowledgement. |
Excursions shorter than a limit's sustained time never produce an event. The full event history, with filters, is available to organization administrators in Alarm history and audit log.
Downtimes for this service
This section lists downtime windows for the service that are active right now, each with its reason, the window in your timezone and by the user who scheduled it. Windows scheduled for the future are not listed until they begin. When there are none it reads "No active downtimes for this service."
Operators and organization administrators also see:
- Cancel on each row (asks "Cancel this downtime?"). After you cancel, the list refreshes and shows the remaining windows as
YYYY-MM-DDTHH:MM → YYYY-MM-DDTHH:MM UTC; reload the page to see them in your timezone again. - Schedule new downtime for this service — a collapsible form with Reason, a start time and an end time. The times are entered in your profile timezone; the form is pre-filled with the current time in that timezone plus five minutes and plus one hour. Pulse stores the window in UTC, and the list above the form and the dashboard display it in your timezone.
For the procedure, validation messages and what a downtime suppresses, see Muting and downtimes.
Note
Charts need your browser to reach public content delivery networks (cdn.jsdelivr.net for the charting library and cdn.tailwindcss.com for page styling). On a network that blocks them the page loads but charts do not draw.