The dashboard
Who can do this: viewers, operators and organization administrators can view the dashboard. Only operators and organization administrators can acknowledge alarms or cancel downtimes from it.
The dashboard is the page you land on after signing in (click the Pulse logo in the header to return to it from anywhere). It has three blocks, top to bottom: Your Services, Active Alarms and Current Downtimes. You see the services of every organization you hold a role in.
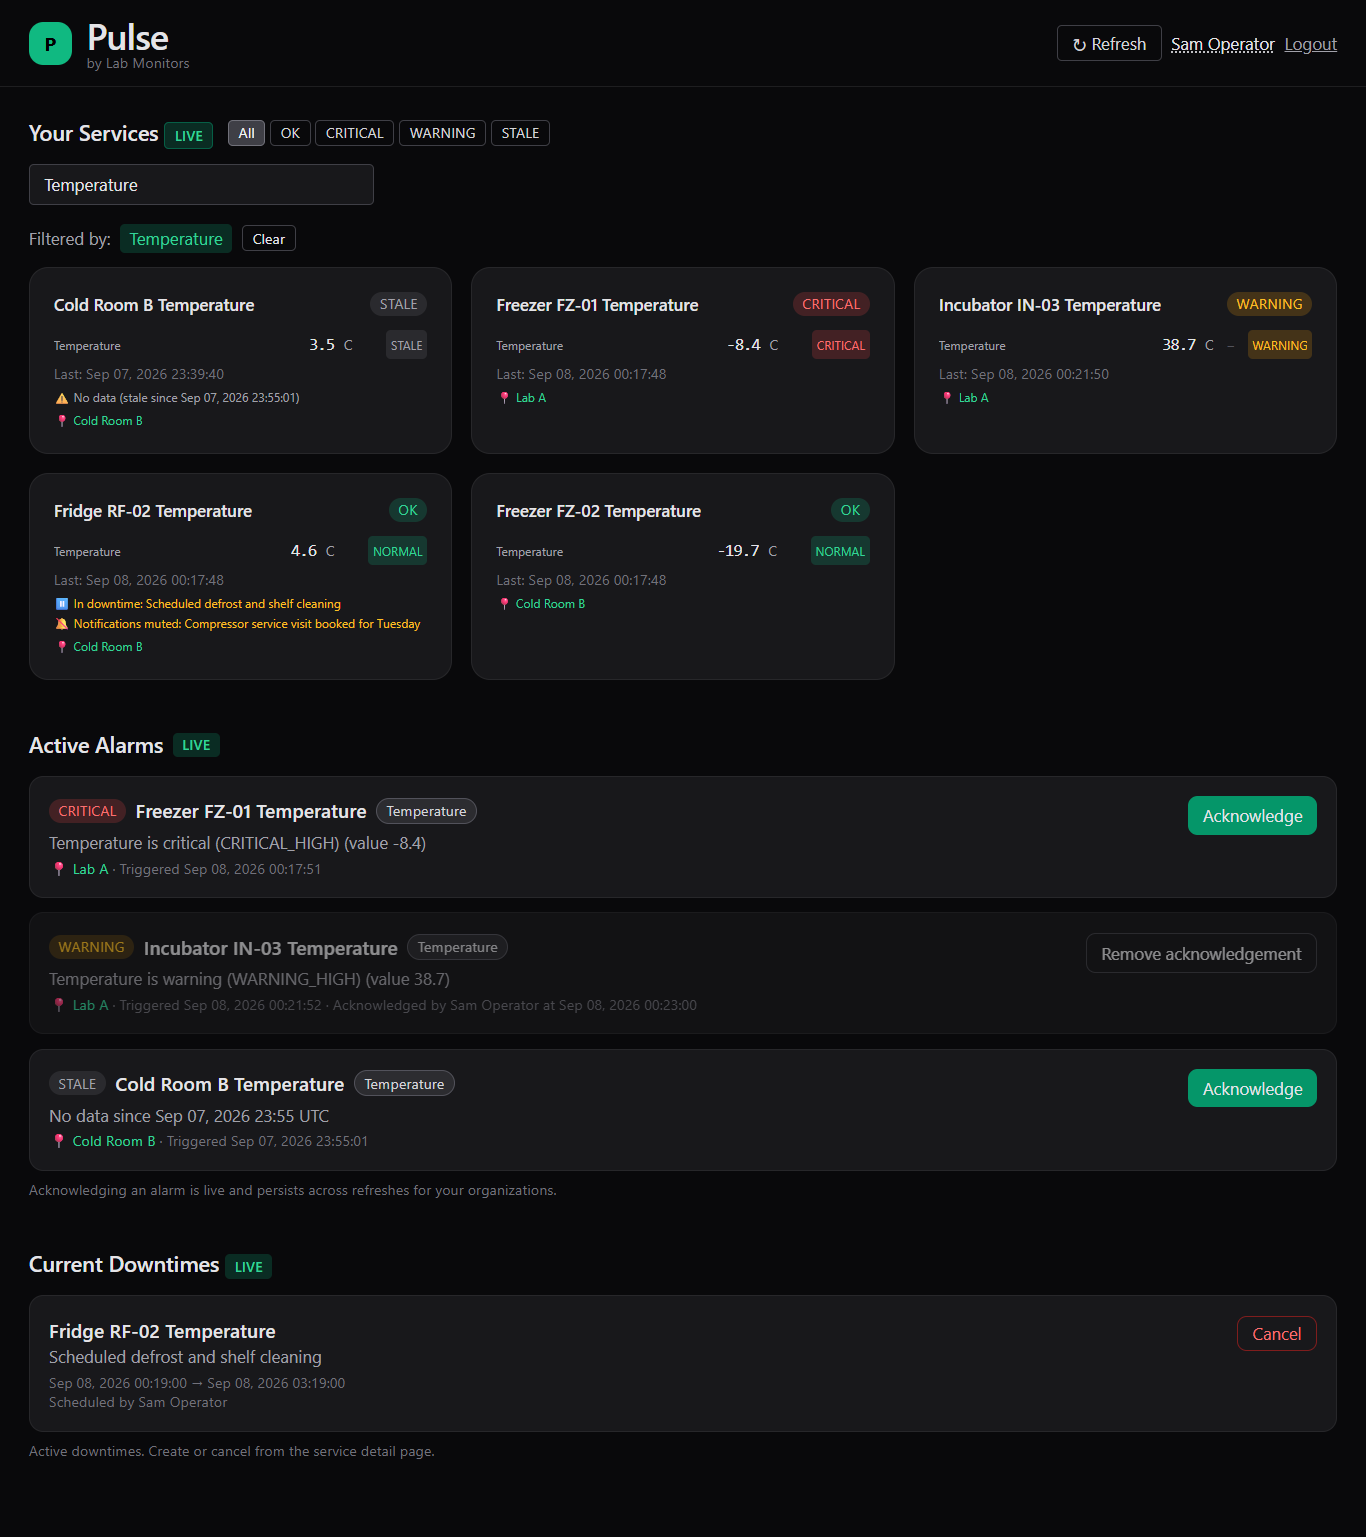
The dashboard: Your Services, Active Alarms and Current Downtimes.
Refresh cadence
All three blocks refresh themselves every 15 seconds. Click ↻ Refresh in the header to refresh all three immediately. Refreshing does not disturb the search box, the state filter or the page you are on.
Each block heading carries a status chip:
| Chip | Meaning |
|---|---|
| LIVE | The block is showing current data. |
| Error (Your Services) | Pulse could not load your services. Refresh; if it persists, see Getting help. |
| No access (Your Services) | Your account has no role in any organization. The block also shows "You are not assigned to any organizations. Please contact an administrator to gain access." |
All times on the dashboard are shown in the timezone set on your profile (see Your profile and notification settings), in the format Mon DD, YYYY HH:MM:SS — for example Sep 07, 2026 14:05:32. The one exception is noted under Active Alarms.
Your Services
Each service appears as a card. Cards are arranged in pages of 12 places, but the page count and the "Showing X–Y of Z" figure also count the services that are hidden (see What is hidden), so a page can hold fewer than 12 cards, and a page can be empty while a later page still has cards. Click a card to open its service page.
What a card shows
| Element | Meaning |
|---|---|
| Service name | Top left. |
| Service badge | Top right: OK, WARNING, CRITICAL or STALE. The badge is the worst state across the service's channels. STALE takes precedence: a service whose data has stopped arriving shows STALE even if a limit is also exceeded. |
| Channel rows (up to 4) | One row per channel: label, current value, unit, trend arrow and a per-channel badge. Battery channels are never listed. If the service has more than four channels, only the first four appear on the card; the service page shows them all. |
| Trend arrow | ▲ trending up, ▼ trending down, – stable, computed over the last hour. Hover the arrow for the wording. No arrow appears when there are fewer than three readings in the last hour. |
| Last: | Time of the most recent reading. |
| ⚠ No data (stale since …) | Shown only when the service is stale, with the time Pulse marked the service stale (normally the service's stale threshold after the last reading; see How alarms work). |
| ⏸ In downtime: reason | Shown while a downtime window is active for the service. |
| 🔕 Notifications muted: reason | Shown while notifications for the service are muted. |
| 📍 Location | Click it to filter the cards to that location. |
| 👥 Groups | Click a group name to filter the cards to that group. |
The state names are explained in How alarms work.
What is hidden
A service does not appear on the dashboard when:
- it has no channel mapped to it yet (other than a battery channel);
- the asset it is linked to has been deactivated;
- it has been archived (see Archiving and restoring services).
A service in downtime is not hidden. Its card stays on the dashboard with its real badge and the ⏸ In downtime line, but its alarms are removed from Active Alarms for the duration of the window.
Filter, search and paging
- State buttons — All, OK, CRITICAL, WARNING, STALE. STALE shows every stale service. OK, CRITICAL and WARNING show services in that state that are not stale.
- Search — the box labelled Search services, locations or groups... matches any part of a service name, location name or group name, ignoring case. Results update about a third of a second after you stop typing. Searches are limited to 200 characters.
- Filtered by: — active filters appear as chips above the cards. Click Clear to remove them all.
- Paging — when there are more than 12 matching services (hidden services included), ← Prev, Page N and Next → appear above the cards together with "Showing X–Y of Z".
If nothing matches, the block reads "No services match your filters." When you have typed a search term it also reads "No services match your search."
Active Alarms
This block lists every alarm currently active in your organizations, refreshed every 15 seconds. When there are none it reads "No active alarms. Nice work."
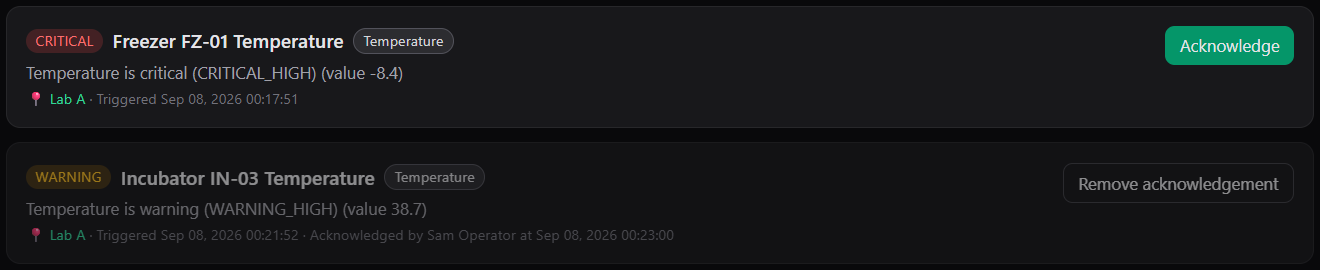
Active Alarms*: a CRITICAL row with Acknowledge and an acknowledged row with Remove acknowledgement*.
Row anatomy
| Element | Meaning |
|---|---|
| Severity badge | CRITICAL, WARNING or STALE. A service whose data has stopped arriving shows STALE even if its last known state was WARNING or CRITICAL. |
| Service name | Click anywhere in the row text to open the service page. |
| Channel chip | The channel in alarm, for example Temperature. Hover it to see "Channel in alarm". |
| Message | For a limit alarm: the channel, the severity, usually the limit that was crossed, and the value that triggered it — for example Temperature is critical (CRITICAL_HIGH) (value 9.1). For a stale service: No data since Sep 07, 2026 14:05 UTC (this time is always in UTC), or No data (sensor stale). |
| 📍 Location | The location of the asset, when one is set. |
| Triggered | For a limit alarm, when the service entered its current severity. For a stale service with no limit alarm, when Pulse marked the service stale. |
| Last telemetry | Stale rows only: the time of the last reading received. |
| Acknowledged by X at T | Shown once the alarm has been acknowledged. |
Ordering
Rows are ordered CRITICAL first, then WARNING, then STALE. Within each group the most recently triggered alarm is at the top.
Acknowledged rows
An acknowledged alarm stays in the list but its row is dimmed, and the row gains the Acknowledged by X at T text. Acknowledging changes who is notified, not the state of the service; see Acknowledging alarms.
What is hidden
- Alarms for a service that is currently in a downtime window.
- Alarms for archived services.
Operator controls
Operators and organization administrators see a button at the right of each row:
- Acknowledge — acknowledges the alarm immediately. There is no confirmation step and no comment box; the acknowledgement is recorded with the comment "Acknowledged via dashboard".
- Remove acknowledgement — appears instead of Acknowledge on an acknowledged row and removes the acknowledgement immediately.
Viewers see the row without a button. For what acknowledging does and does not do, see Acknowledging alarms.
The text under the block, "Acknowledging an alarm is live and persists across refreshes for your organizations.", means an acknowledgement is stored on the server: everyone in the organization sees it after the next refresh.
Current Downtimes
This block lists downtime windows that are active right now across your organizations, refreshed every 15 seconds. Scheduled windows that have not started yet, and windows that have ended, are not listed. When there are none it reads "No active downtimes."
Each row shows:
| Element | Meaning |
|---|---|
| Service name | Click to open the service page. |
| Reason | The reason entered when the downtime was scheduled. |
| Start → End | The window, in your timezone. |
| Scheduled by | The user who scheduled it, or "Unknown". |
Rows are ordered by start time, most recent first.
Cancelling a downtime
Every row carries a Cancel button. Clicking it asks "Cancel this downtime?"; confirming ends the window immediately and removes it from the list. Only operators and organization administrators can cancel a downtime; for anyone else the request is refused and the window remains.
The note under the block, "Active downtimes. Create or cancel from the service detail page.", points to where downtimes are scheduled: see Muting and downtimes.
Note
Cancelling a downtime re-arms notifications for the service. Any alarm that was active during the window reappears in Active Alarms on the next refresh.