Alarm history and audit log
Who can do this: organization administrators. Operators and viewers cannot open either page; they see only the Recent Events list (the last 8 events) on each service page. See Service pages and charts.
Both pages are reached from the Admin hub (Admin in the header): Alarm History and Audit Log. Each shows only your organization's records, 100 rows per page, newest first. Next → appears when a page is full; ← Prev goes back. Records are kept indefinitely.
Alarm History
The Alarm History page lists every alarm event across your services: what fired, when, and how severe. It is the operational complement of the audit log, which tracks configuration changes.
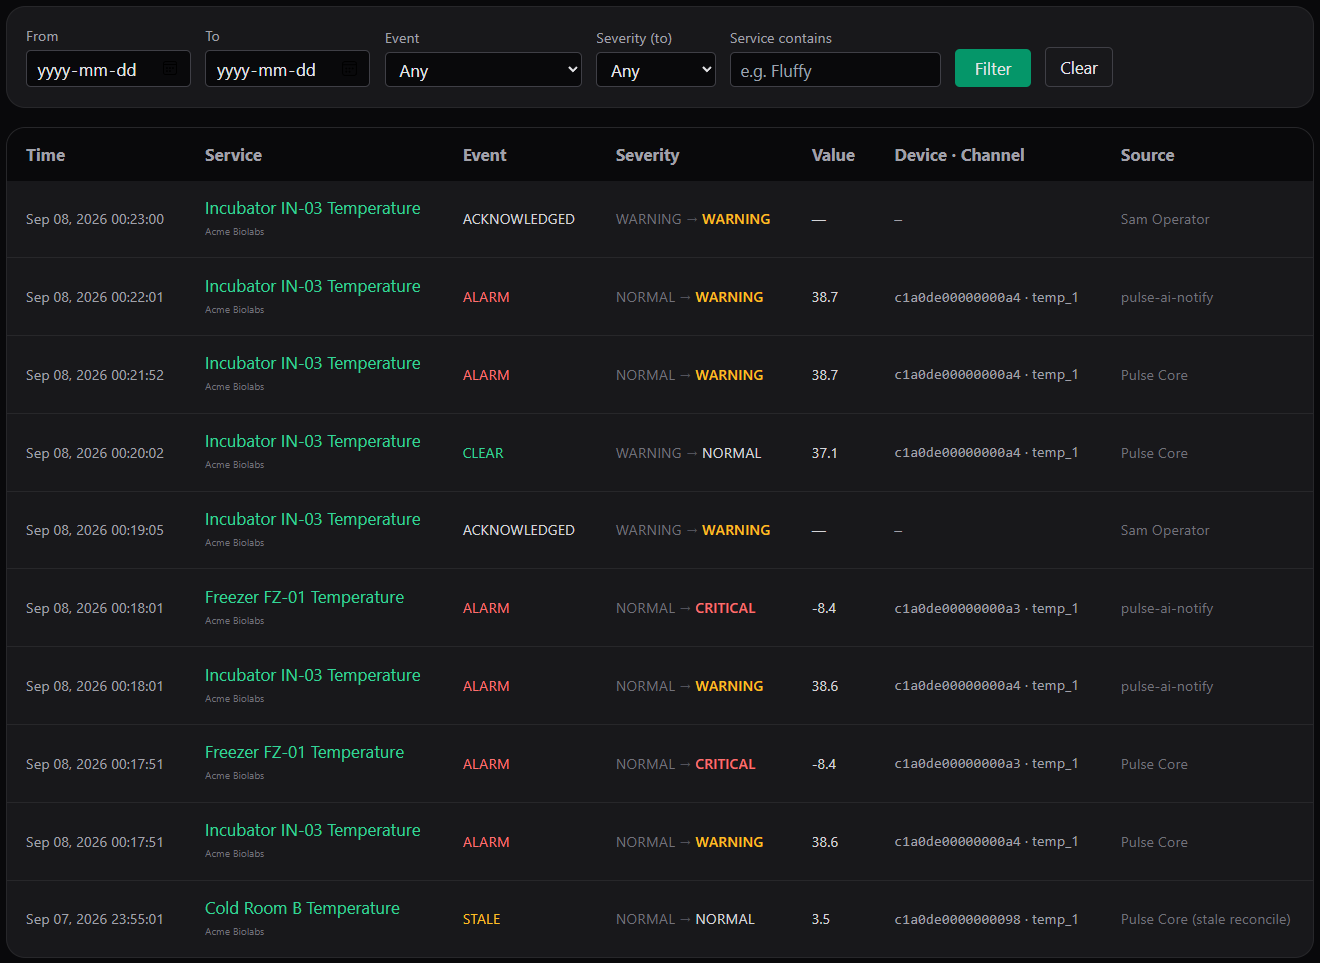
Alarm History: the filter bar and a table of ALARM, CLEAR, ACKNOWLEDGED and STALE events.
Filters
| Filter | Meaning |
|---|---|
| From / To | Calendar dates, both inclusive, interpreted in your timezone (from 00:00 on the From date to 23:59 on the To date). A From date after the To date matches nothing. A value that is not a date is ignored. |
| Event | One event type (see below), or Any. |
| Severity (to) | Show only events whose resulting severity is CRITICAL, WARNING or NORMAL, or Any. |
| Service contains | Part of a service name. Archived services are included. |
Click Filter to apply, Clear to reset. When nothing matches, the page says No alarm events match the current filters.
Columns
| Column | Meaning |
|---|---|
| Time | When the event was recorded, in your timezone. |
| Service | Link to the service page, with the organization underneath. |
| Event | The event type. |
| Severity | from → to: the severity before and after the event. — where not applicable. |
| Value | The reading that caused the event, where applicable. |
| Device · Channel | The device EUI and channel the event relates to. |
| Source | Who or what recorded the event: a user's name, Pulse Core (the alarm engine) or pulse-ai-notify (the notification sender). |
Event types
| Event | Meaning |
|---|---|
| ALARM | The service entered WARNING or CRITICAL, or changed between them. A row is written for the initial alarm and for every escalation (WARNING → CRITICAL) or de-escalation (CRITICAL → WARNING). A second ALARM row for the same alarm with source pulse-ai-notify and severity NORMAL → <severity> records that the alarm notification was sent. |
| CLEAR | The service returned to NORMAL. |
| STALE | The service stopped receiving data (no reading within Stale after (minutes)), or a companion setpoint/state channel became unavailable. The severity columns both show the severity the service had when data stopped. |
| RECOVERED | Data resumed after a STALE. Both severity columns show the current severity. |
| ACKNOWLEDGED | Someone acknowledged the alarm. Source is the user's name; an acknowledgement by SMS reply shows as sms-ack:user-<id>. Both severity columns show the acknowledged severity; Value and Device · Channel show —. |
| UNACKNOWLEDGED | Someone removed the acknowledgement. No row is written when an acknowledgement is removed by saving the service's limits; see Alarm limits and policies. |
| ESCALATED, SUPPRESSED | Available in the filter, but no events of these types are currently recorded. |
Things that do not appear in the history:
- Excursions shorter than a band's Sustained (min). They never become alarms and leave no row.
- Notifications themselves (which emails or messages went out). Only the
pulse-ai-notifyALARM row marks that the initial notification was sent. - Mutes and downtimes; these are in the audit log.
Audit Log
The Audit Log records who changed what in Pulse. Every configuration change made through the interface or the API by a user of your organization is listed, together with sign-ins and alarm handling actions.
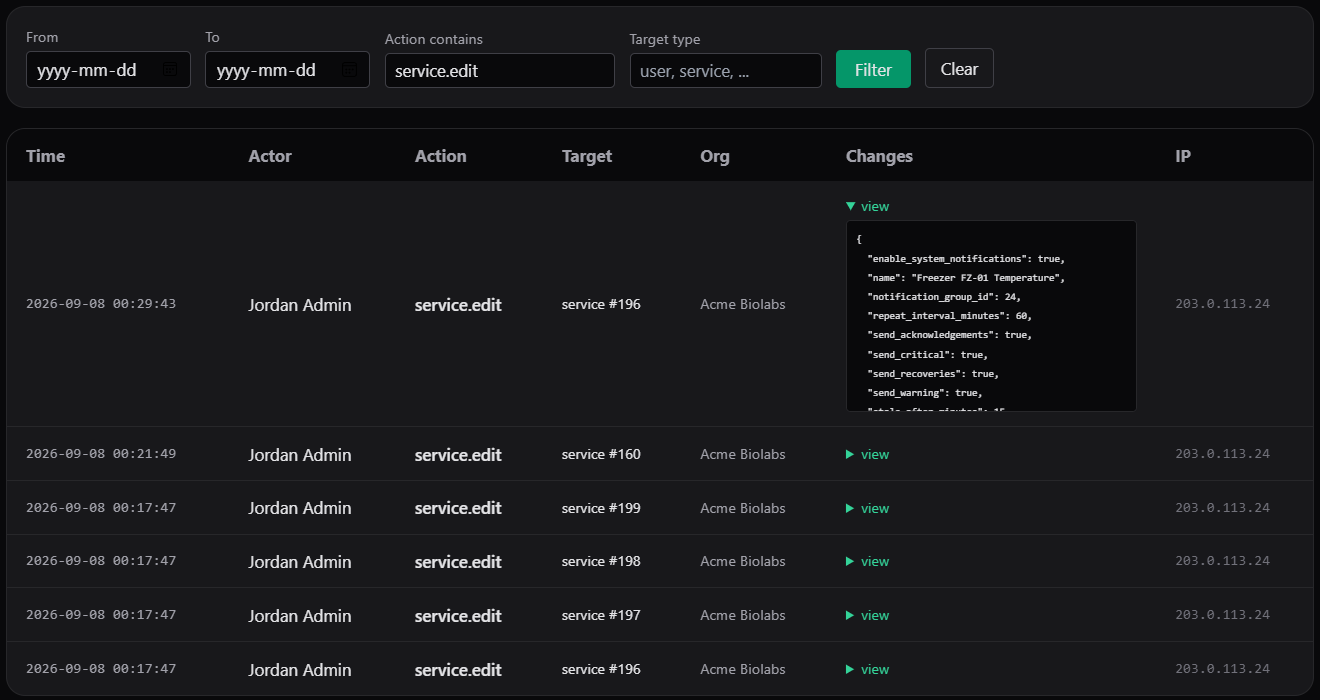
The Audit Log filtered to service.edit, with one entry's Changes expanded.
Filters
| Filter | Meaning |
|---|---|
| From / To | Calendar dates, both inclusive, interpreted in your timezone even though the Time column is shown in UTC. For example, with the timezone America/Vancouver, From = To = 15 June lists entries stamped 2026-06-15 07:00 to 2026-06-16 06:59 UTC. A From date after the To date matches nothing; a value that is not a date is ignored. |
| Action contains | Part of an action name, for example user, policy, downtime. |
| Target type | Part of a target type, for example user, service, device. |
Click Filter to apply, Clear to reset. When nothing matches, the page says No audit entries match the current filters.
Columns
| Column | Meaning |
|---|---|
| Time | When the action happened, in UTC (not your timezone). |
| Actor | The user who performed the action, or system. |
| Action | The action name (see below). |
| Target | The type of object and its number, for example service #12. |
| Org | The organization. |
| Changes | view expands the details that were recorded, such as the old and new values. — if nothing was recorded. |
| IP | The network address the action came from. |
Actions performed by Lab Monitors at platform level (organizations, device profiles, gateways) are not part of your organization's log. Neither are sign-ins and sign-outs, nor the permanent deletion of a user (see Delete a user).
What is recorded
| Area | Actions |
|---|---|
| Users | user.create, user.update (including deactivating and reactivating), user.password_reset (an administrator set a password), user.self_update and user.password_change (the user's own profile), user.activate (the user set their first password) |
| Alarm handling | alarm.acknowledge, alarm.unacknowledge, service.mute, service.unmute, downtime.create, downtime.cancel |
| Limits and notification settings | service.edit (saving the service page panel), service.band.delete (deleting a band or clearing all), policy.apply_recommendation (applying an AI recommendation) |
| Services and mappings | service.create, service.update (name, type, asset, Enabled), service.delete (archive), service.restore, service.mapping.upsert (add), service.mapping.remove, service.mapping.update (label, unit, primary) |
| Assets and locations | asset.create, asset.update (including renaming), asset.delete, asset.service.link, asset.service.unlink, location.create, location.update, location.delete, location.asset.add, location.asset.remove |
| Groups | group.create, group.update, group.delete, group.member.add, group.member.remove |
| Devices | device.register, device.import, device.update, device.calibration.update, device.downlink, and, when Lab Monitors support acts on your devices, device.decommission, device.reactivate, device.delete |
Changing the display order of a service's channels (the ▲ / ▼ buttons) is not recorded.
The service.edit entry records the notification settings that were saved; the band values themselves are not listed in Changes. A service.band.delete entry records the band name (or ALL with cleared_all: true) and the channel. The limits in force at any time can be seen in the service page's Alarm Limits & Delays section, and the history of limit versions is kept with the service.